The product
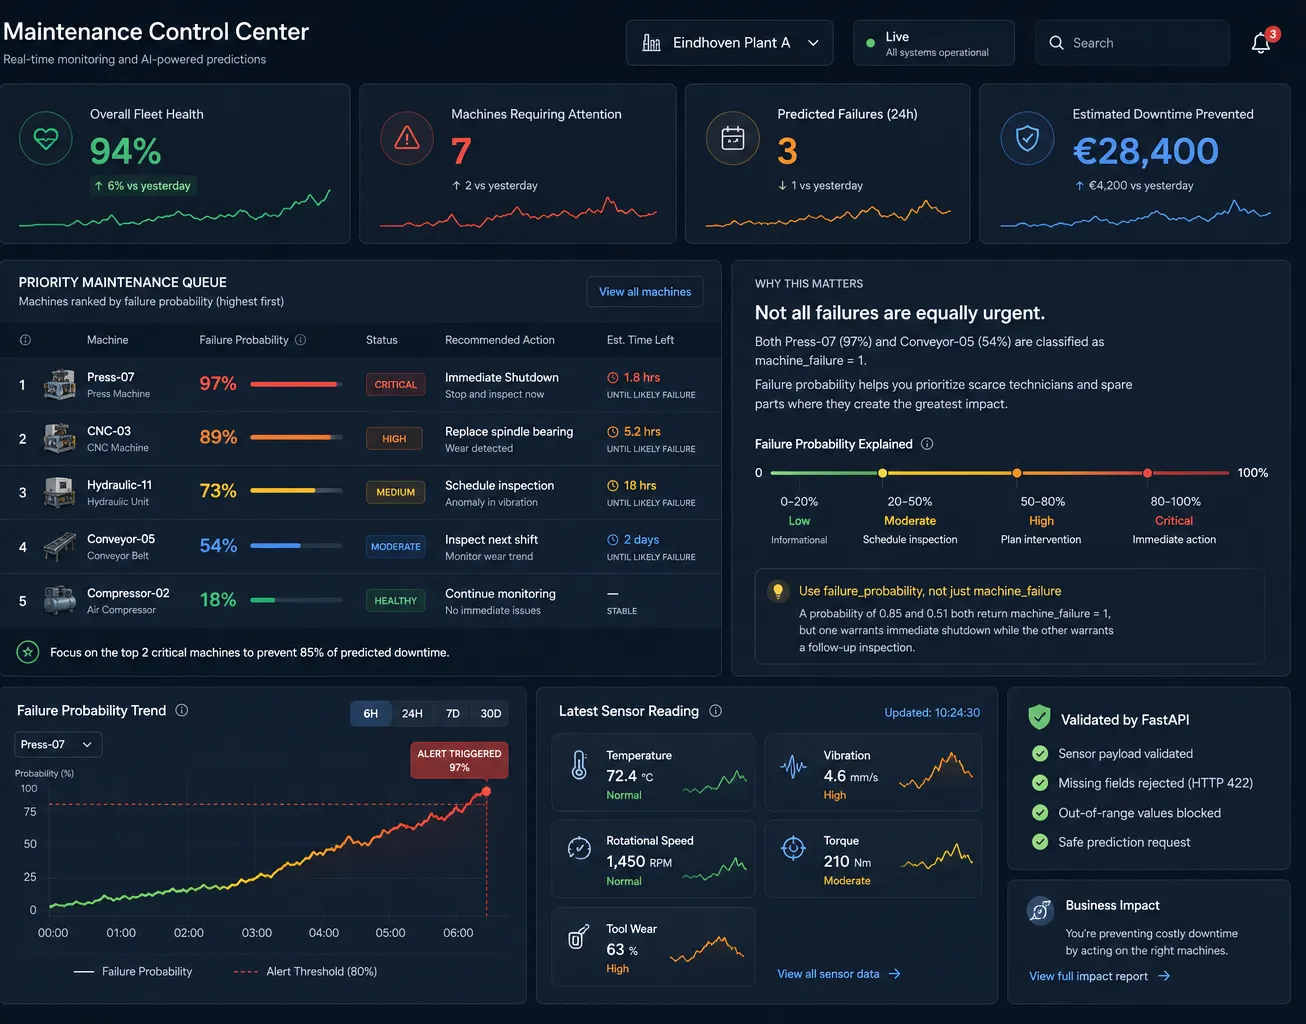
Here’s what the dashboard could look like.
in a real factory setting: A maintenance control center: fleet health, machines ranked by failure probability, and live sensor readings. The sidebar is interactive, and serves either mockups or real data— click through the sections yourself to explore.
Live Machines
A real run of the demo, recorded and played back. Every sensor reading and every probability below came out of the production models — none of it is mocked up.
—
—
Dashed line marks the 80% alert threshold.
Air temp
— K
Process temp
— K
Rotational speed
— rpm
Torque
— Nm
Tool wear
— min
Recorded 5 Aug 2026 · 60 minutes of factory time · models v36 / v32. Readings come from the demo’s own sensor generator, sampled from the AI4I 2020 dataset; the probabilities are what the production models returned for them. Machine ids are the real ones from the run.
Maintenance Queue
This part of the dashboard is still in development.
Work Orders
This part of the dashboard is still in development.
Model Health
How well the model that’s serving predictions right now actually performs — read from the model registry when this page was built, not typed in by hand.
In plain terms: it misses roughly 1 failure in 6, and about 8 of every 100 warnings turn out to be false alarms. Every retrain is scored the same way before it’s allowed to replace the model already in production.
Reports
This part of the dashboard is still in development.
About this demo
Predictive maintenance for industrial equipment — a complete MLOps pipeline: live sensor predictions, automated drift monitoring, and self-triggering retraining.
A capstone project showcase built on simulated CNC sensor data — not a live paying-customer deployment.
- Program
- neuefische AI Engineering Bootcamp · Cohort 2026
- Source
- GitHub repository
- Privacy
- No analytics, no tracking
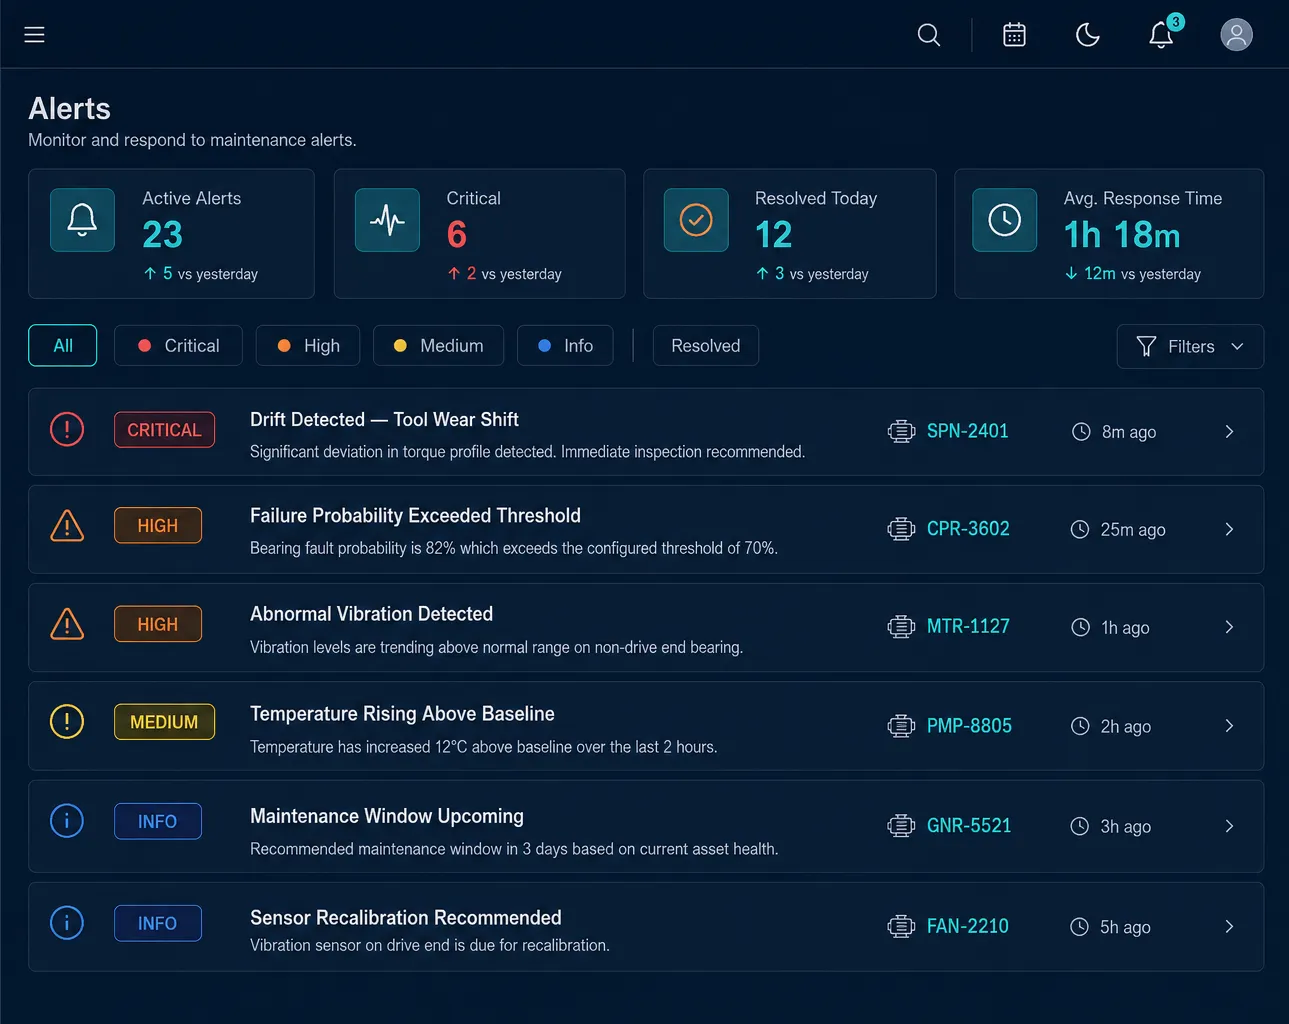
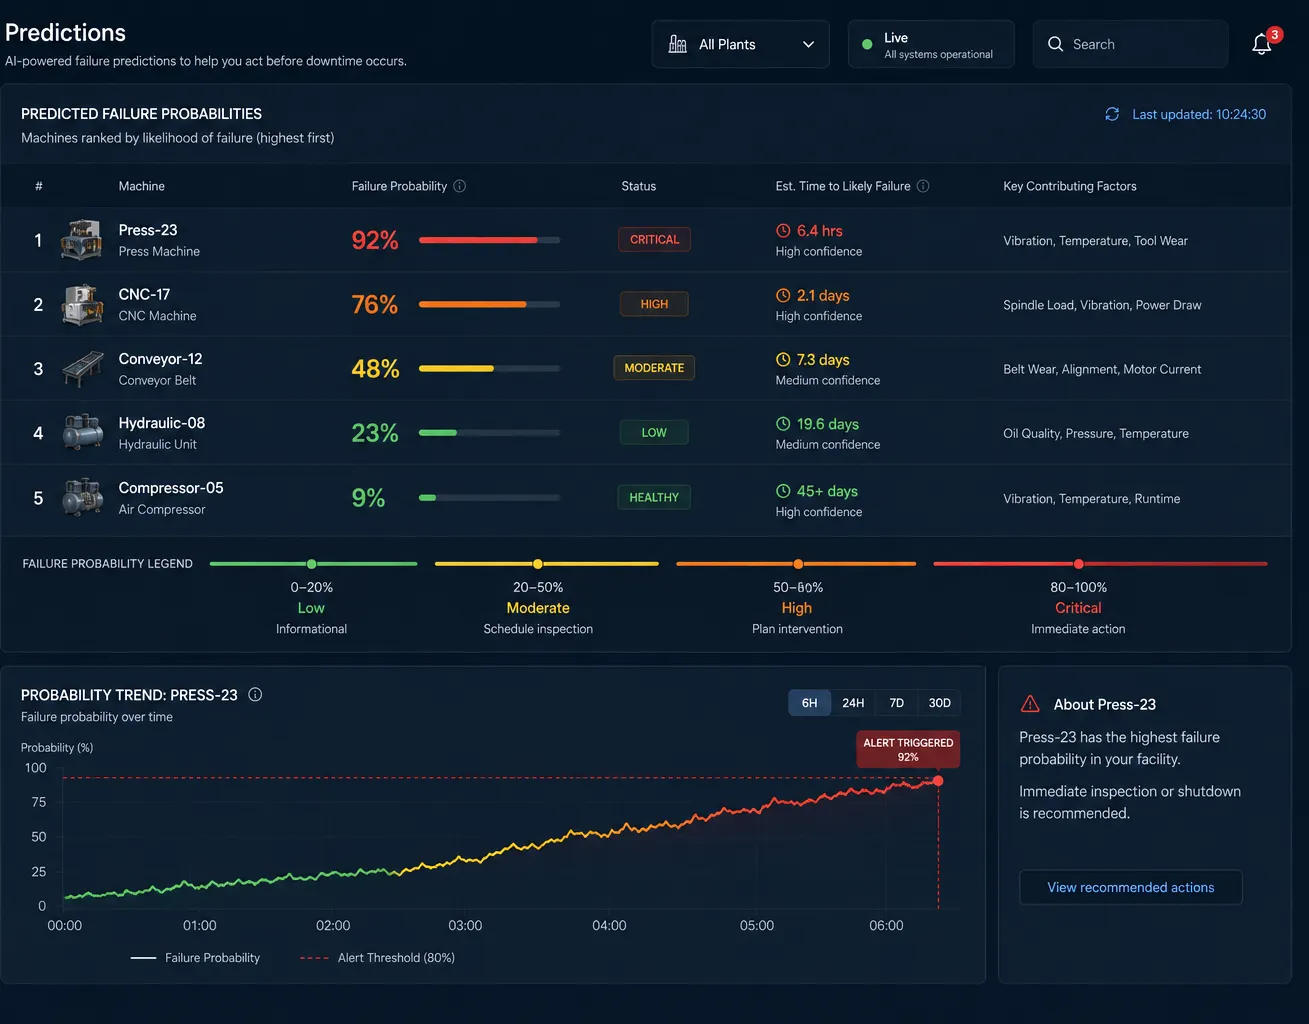
Model Health and Settings show real, live data from the production model. Overview, Alerts, and Predictions are dashboard previews of how a full deployment might look.